The Biham-Middleton-Levine Traffic Model
(See below for information about the pictures).
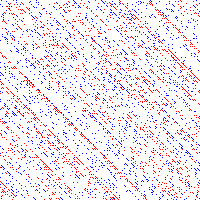
10% cars
| 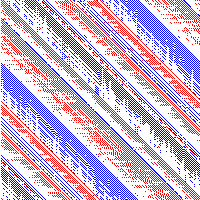
30% cars
| 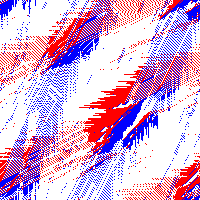
32% cars
|
32% cars
| 
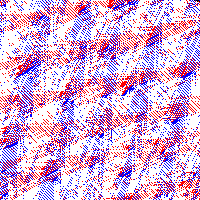
34% cars
| 
80% cars
|
What is this?
The following simple model for traffic congestion was introduced in
[2]. Each intersection of a square grid of streets contains either an
East-facing car, a North-facing car, or an empty space. At each
odd-numbered time step, all the North-facing cars simultaneously
attempt to move one unit North; a car succeeds if there is already an
empty space for it to move into. At each even-numbered time step, the
East-facing cars attempt to move East in the same way.
Initially, cars are distributed at random: each intersection is
independently assigned a car with probability p, or an empty space
with probability 1 - p. Each is car is independently equally likely to
be East-facing or North-facing.
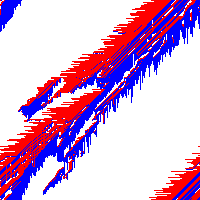
The pictures show results of running the model for 20,000 steps on a
200x200 grid with "periodic boundary conditions" - that is, a car
which falls of the East edge of the board immediately returns on the
West edge, and a car which falls off the North returns on the South.
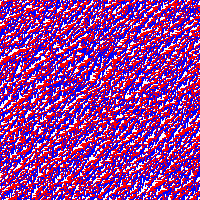
The initial densities of cars p in the various pictures are 10%, 30%,
32% (two examples), 34%, and 80%. East-facing cars are red,
North-facing cars blue.
Phase transition
Judging by the pictures, the behaviour of the model seems to depend
drastically on the density of cars p. For high densities (e.g. 80%,
34%), after a while traffic becomes jammed, and no car can move at
all. For low densities (e.g. 10%, 30%), after a while traffic is
completely free flowing, and no car ever has to wait at all. For
densities close to the cutoff between these two behaviours, the model
appears to exhibit remarkable large-scale organisation; e.g. in the
34% picture there is a single jam spanning the entire grid, while in
the 30% picture the cars have arranged themselves into wide diagonal
bands which avoid each other. For densities very close to the
cutoff, other types of "intermediate" behaviour are seen. In the two
32% pictures, all cars move some of the time and wait some of the
time, and this is achieved by remarkable semi-regular geometic
patterns of jams feeding into each other.
Mathematics
Although the model is very simple, rigorous analysis appears to be
difficult. The only rigorous progress so far is a proof [1] that
(with high probability as the box becomes large) traffic does indeed
become fully jammed when the density of cars p is high enough. It is
an open problem to prove anything about small p, even that traffic is
not fully jammed when p is sufficiently small (uniformly in the
size of the box).
More information on simulation is reported in [3],[4]; in particular,
the mysterious "intermediate phases" are investigated there.
References
[1] O. Angel, A. E. Holroyd & J. B. Martin: The Jammed Phase of the Biham-Middleton-Levine Traffic Model. Electronic Communications in Probability, 2005, Vol 10, Paper 17, 167-178.
[2] O. Biham, A. A. Middleton & D. Levine:
Self-organization and a dynamical transition in traffic-flow models
. Phys Rev A, Vol 46, Issue 10, 1992, R6124-R6127
[3] R. M. D'Souza:
Coexisting phases and lattice dependence of a cellular automata model for
traffic flow, Physical Review E, Volume 71, 066112 (2005).
[4]
The Biham-Middleton-Levine traffic model. Raissa D'Souza's page.
Alexander E. Holroyd 2005